Simulation of Solar Cell Properties with Electronic Circuit Simulation Software
The "student" version of the "AIMSpice" simulator (a version of the Berkeley Spice electronic circuit simulation program) has been used to explore electrical characteristics of photovoltaic cells and groups of photovoltaic cells.
Part one of the exercise is to explore the effect of basic cell parameters on the I-V and P-V curves. A netlist for the circuit to be simulated was entered, and altered as variants needed to be simulated. The basic netlist appears below:
*analog to PV cell

I1 0 1 dc 4
d1 1 0 diode1
rsh1 1 0 100
rs1 1 2 .1
e1 2 0 20 0 1

I11 0 11 dc 4
d11 11 0 diode2
rsh11 11 0 100
rs11 11 12 .01
e11 12 0 20 0 1

I21 0 21 dc 4
d21 21 0 diode3
rsh21 21 0 100
rs21 21 22 .001
e21 22 0 20 0 1

I31 0 31 dc 4
d31 31 0 diode4
rsh31 31 0 100
rs31 31 32 .0001
e31 32 0 20 0 1

* load control voltage
vds 20 0
rds 20 0 100

.MODEL diode1 D IS=1e-6 N=1.5
.MODEL diode2 D IS=1e-6 N=1.5
.MODEL diode3 D IS=1e-6 N=1.5
.MODEL diode4 D IS=1e-6 N=1.5
Assumed PV cell parameters are:
- Il = 4.00 Amps
- I0 = 1.00E-6 Amps (in the second part, involving multiple cells in a panel, 1E-7 was assumed).
- N (ideality factor) = 1.5
- Rs = 0.001 ohms
- Rsh = 100 ohms
This netlist actually simulates 4 cells simultaneusly, each with a different Rs (ranging from 0.1 to 0.0001). The control voltage, vds, is swept from 0 to 0.7 volts. It's value controls the voltage of voltage-dependent voltage sources e1, e11, e21, and e31, allowing simultaneous simulation of several devices with identical stimulus. The following figure shows the results of this simulation.
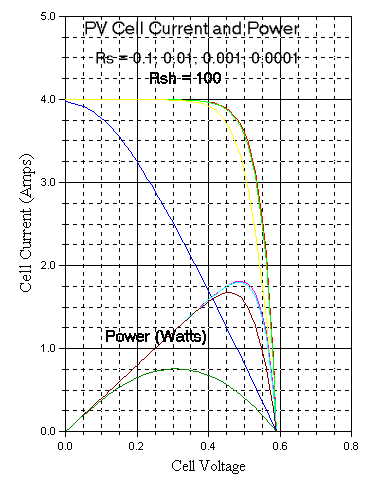
Also plotted on this graph is the power delivered. One can see a significant loss in PV cell performance at Rs = 0.1 ohm, and a slight loss at 0.01 ohm. By contrast, almost no improvement is seen reducing Rs from 0.001 to 0.0001 ohm.
Similar simulations were done to investigate the effect of varying Rsh (1, 10, and 100 ohms). The following graph was obtained.
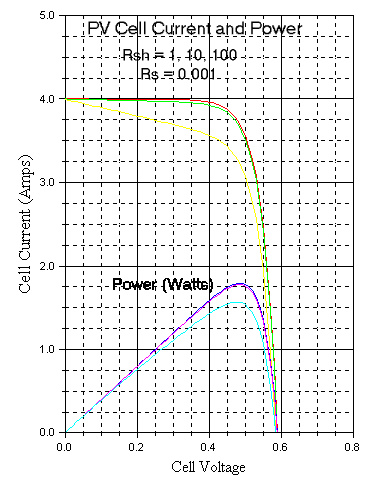
Little degradation is seen decreasing Rsh to 10 ohms. Significant degradation is seen at Rsh = 1 ohm.
The simulations show the expected results for both series and parallel resistance. Series resistance has no effect on Voc, but can reduce ISC. Shunt resistance doesn't affect Isc, but reduces Voc. The power curves demonsrate how increased Rs or decreased Rsh reduce the power that the cell can deliver.
The base fill factor of the cell can be calculated from points on the graph.
- FF = Pmax / Voc * Isc
- = 1.77 / 0.58 * 4
- = 0.76
Base efficiency can be calculated knowing maximum power output (1.8 watts) divided by power input (100 cm2 * 1000 W/m2).
E = 1.8 watts / (.01m2 * 1000w/m2) = 0.18.
The graphs show the change in Pmax for higher values of Rs and lower values of Rsh. The fill factor and efficiency for these cases declines in proportion to the ratio of the reduced maximum power to the base case.
The simulator was also used to simulate the behavior of the cell
under reduced light conditions. To do this, the value of the current
source (I1, I11, I21, I31) is changed in proportion to the
decline in light level. The following graph shows cell performance
under one sun (Il = 4 amps), 0.75 sun (Il = 3 amps), 0.5 sun (Il - 2 amps), and
0.25 sun (Il = 1 amp).
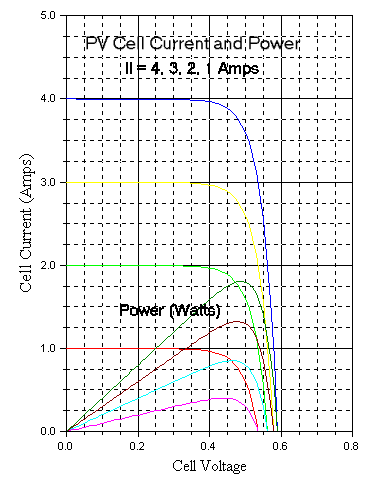
The graph shows the expected uniform downward shift of the I-V curve, with attendent decline in Voc. The fill factor can be calculated as before for the reduced light curves. For 0.5 sun, Isc = 2 amps, Voc is about 0.56 volts, and Pmax is 0.75 watts. This gives
FF = 0.75 / (.56 * 2) = 0.67.
Compare this to the previously calculated 1-sun fill factor of 0.78.
An interesting experiment is to check the potential benefit of
a concentrating arrangement. The circuit simulator would handle
this easily, along with the temperature increase likely as a result
of concentration. Supposing a 4:1 concentrator were used. Il would
go to 16 amps. Perhaps temperature would increase by 10 degrees
(previous runs were done with the default, 27C. These will be done
at 37C). The following basic curves result:
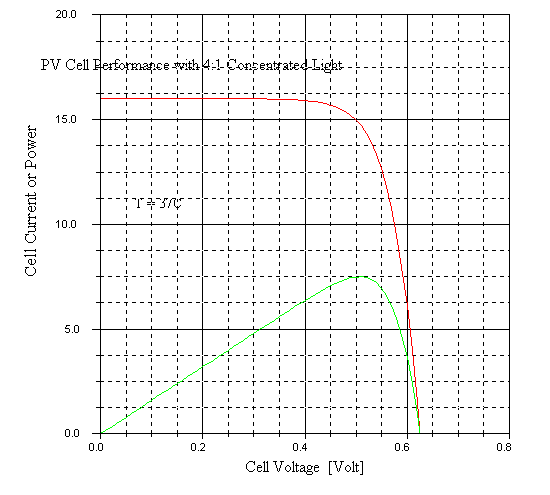
The fill factor for this configuration is
FF = 7.5 Watts / (.625 Volts * 16 Amps) = 0.75
It appears that we have lost slightly in fill factor (detrimental effect of increased temperature was more than the beneficial effect of concentration). This is obviously a complex problem, but the circuit simulator is an effective tool for exploring the tradeoffs.
Part two of the exercise requires that 36 cells be connected in series, as they would be in a panel. The following Spice netlist shows the basic configuration:
*PV cell I-V Curve for Array w/bp diodes with one module receiving .4 sun

* One shaded cell
I1 4 5 dc 4
d1 5 4 diode1
rsh1 5 4 100
rs1 5 6 .001

* 17 unshaded cells
I2 2 3 dc 4
d2 3 2 diode2
rsh2 3 2 1700
rs2 3 4 0.017

* 18 unshaded cells
I3 0 1 dc 4
d3 1 0 diode3
rsh3 1 0 1800
rs3 1 2 0.018

dbp1 0 2 diodebp
dbp2 2 6 diodebp

* load control voltage
vds 6 0

* Model for one cell
.MODEL diode1 D IS=1e-7 N=1.5

* Model for 17 cells in series
.MODEL diode2 D IS=1e-7 N=25.5

* Model for 18 cells in series
.MODEL diode3 D IS=1e-7 N=27

* bypass diode - plain old diode
.MODEL diodebp D
Actually, this particular netlist splits the cells into groups of 18, with bypass diodes across the groups of 18. (initial assignment notes did not correctly specify I0...for these runs, I happened to guess 1e-7 as the I0, instead of the "correct" 1e-6, so these curves will look a little off; higher voc).
The following curve set shows simulation of this configuration with several shading levels on one cell:
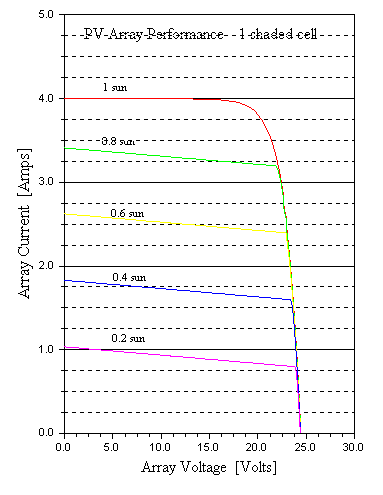
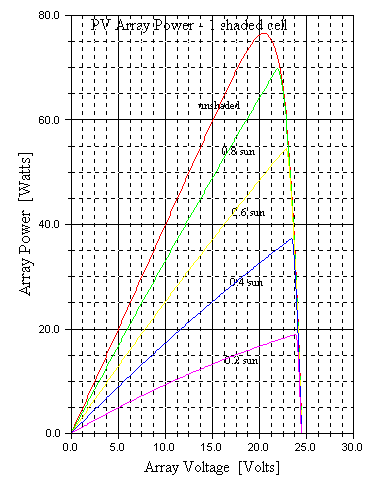
The I-V curves clearly show the current-limiting effect of the single shaded cell. They also show a close to linear decline in array output power (and hence fill factor and efficiency) with shading level of the shaded cell.
The next set of graphs show I-V and P-V for the same configuration, but with bypass diodes across groups of 18 cells.
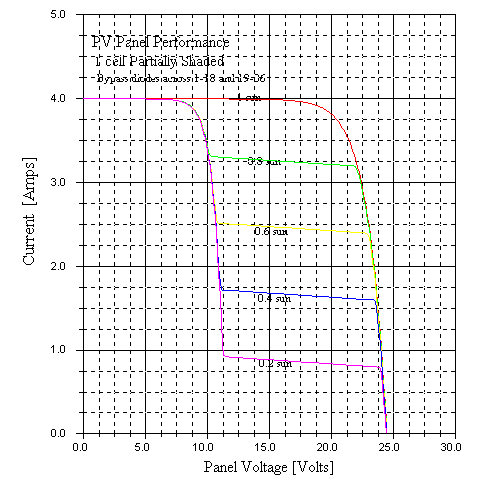
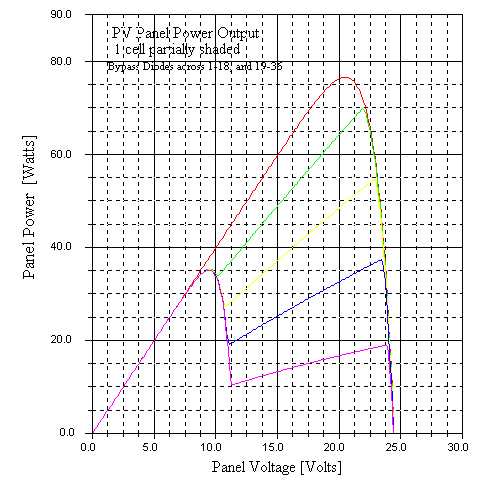
These show a considerable reduction in the negative effects of shading. Still, the effect is pretty significant. An interesting feature to note is the dual peak in the P-V curve. I would imagine that these local maxima could in some cases fool a maximum power tracker into an incorrect decision!
To see what sort of benefit might be obtained from bypassing every cell, the netlist was reconfigured, and a new set of curves generated:
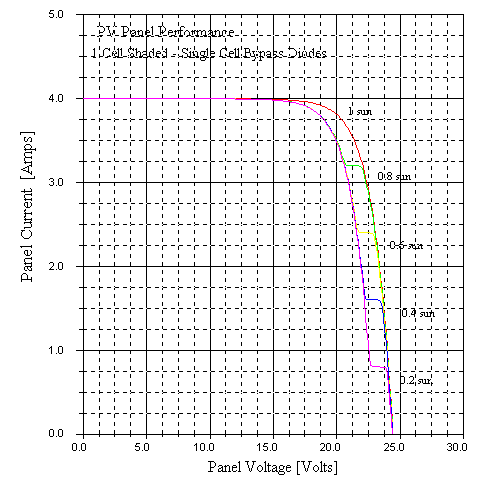
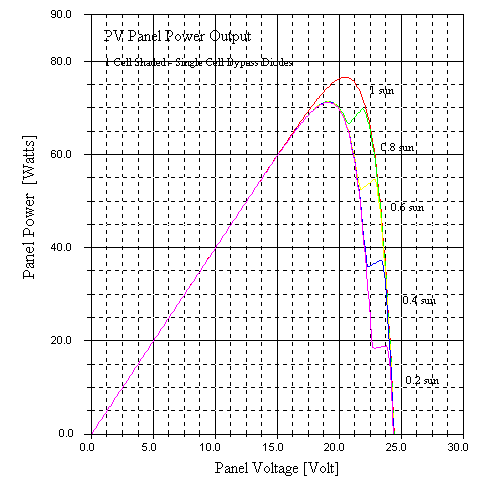
One can clearly see the benefit of this. Although extra bypassing clearly will be expensive, certain applications might well benefit from it.